படிமம்:Greenhouse Gas by Sector.png
Jump to navigation
Jump to search
இந்த முன்னோட்டத்தின் அளவு: 600 × 600 படப்புள்ளிகள் . மற்ற பிரிதிறன்கள்: 240 × 240 படப்புள்ளிகள் | 480 × 480 படப்புள்ளிகள் | 768 × 768 படப்புள்ளிகள் | 1,024 × 1,024 படப்புள்ளிகள் | 1,632 × 1,632 படப்புள்ளிகள் .
மூலக்கோப்பு (1,632 × 1,632 படவணுக்கள், கோப்பின் அளவு: 366 KB, MIME வகை: image/png)

|
File:Greenhouse gas by sector 2000.svg என்பது இந்தக் கோப்பின் திசையன் வடிவமாகும். இந்தக் PNG கோப்பின் இடத்தில் திசையன் கோப்புத் தரம் குறைவாக இல்லாவனில் இதைப் பயன்படுத்த வேண்டும்.
File:Greenhouse Gas by Sector.png → File:Greenhouse gas by sector 2000.svg
மேலும் தகவலுக்கு, உதவி:SVG பார்க்கவும். |
 |
சுருக்கம்
| விளக்கம் |
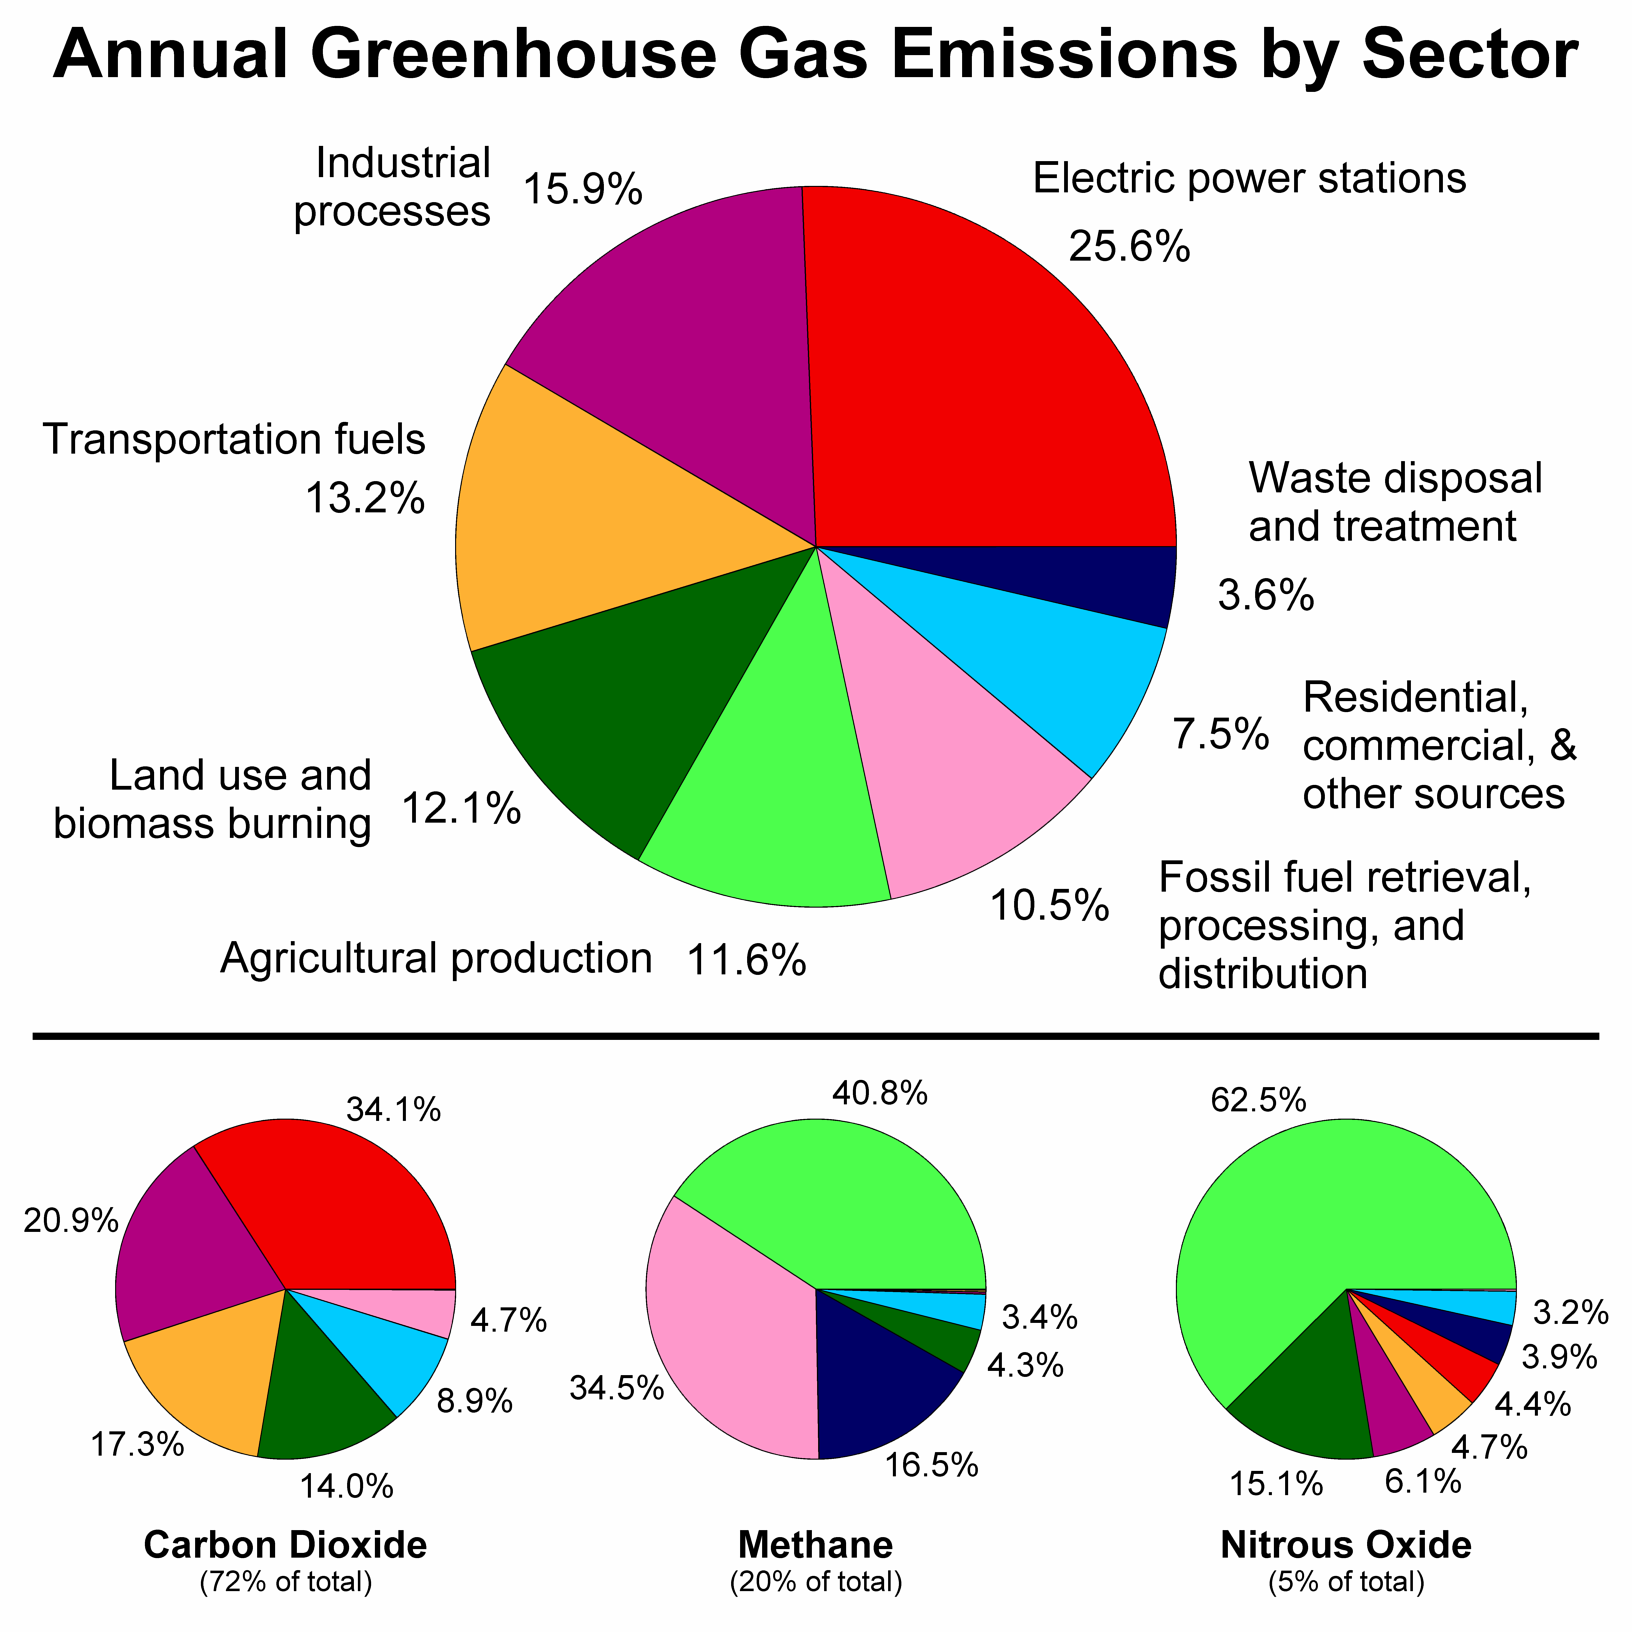
English: This figure shows the relative fraction of man-made greenhouse gases coming from each of eight categories of sources, as estimated by the Emission Database for Global Atmospheric Research version 4.2, fast track 2010 project [1]. These values are intended to provide a snapshot of global annual greenhouse gas emissions in the year 2000.
The top panel shows the sum over all anthropogenic greenhouse gases, weighted by their global warming potential over the next 100 years. This consists of 72% carbon dioxide, 20% methane, 5% nitrous oxide and 3% all other gases. Lower panels show the comparable information for each of these three primary greenhouse gases, with the same coloring of sectors as used in the top chart. Segments with less than 1% fraction are not labeled.
עברית: תמונה זו מראה את החלוקה היחסית של פליטות גזי חממה מעשה ידי אדם, על פי 8 קטגוריות של מקורות, כפי שהדבר מוערך על ידי w:Emission Database for Global Atmospheric Research version 4.2, fast track 2010 project [2].
ערכים אלו אמורים לספק תמונת מצב של שנת 2000. הפנל העליון מראה את סך הפליטות של גזי חממה כשהם נשקלים על פי פוטנציאל אפקט החממה שלהם במשך 100 השנים הבאות. זה מורכב מ 72% של he:פחמן דו חמצני, 20% he:מתאן, 5% he:תחמוצת החנקן, ו3% גזים אחרים. הפנלים התחתונים מראים את ההשוואה היחסית של כל אחד מהגזים האלה, עם אותים צבעים לסקטורים שונים כמו בפנל העליון. סמגנטים עם תרומה נמוכה מ 1% אינם מסומנים. |
| மூலம் | சொந்த முயற்சி |
| ஆசிரியர் | Robert A. Rohde |
| ஒத்தக்கோப்பு |
Derivative works of this file: |

அனுமதி
This figure was prepared by Robert A. Rohde from publicly available data and is part of the Global Warming Art project.
Image from Global Warming Art
This image is an original work created for Global Warming Art. Please refer to the image description page for more information.

|
GNU Free Documentation License விதிமுறைகளின் கீழ் இந்த ஆவணத்தை நகலெடுக்க, விநியோகிக்க மற்றும்/அல்லது மாற்றுவதற்கு அனுமதி வழங்கப்பட்டுள்ளது, Free Software Foundation;ஆல் வெளியிடப்பட்ட பதிப்பு 1.2 அல்லது அதற்குப் பிந்தைய பதிப்பு, மாற்றமில்லாத பிரிவுகள், முன் அட்டை உரைகள் மற்றும் பின் அட்டை உரைகள் இல்லாமல் வெளியிடப்பட்டது. GNU Free Documentation License என்ற தலைப்பில் உரிமத்தின் நகல் சேர்க்கப்பட்டுள்ளது. |
| இந்த கோப்பு Creative Commons Attribution-Share Alike 3.0 Unported உரிமத்தின் கீழ் உள்ளது. | ||
| ||
| This licensing tag was added to this file as part of the GFDL licensing update. |
கோப்பின் வரலாறு
குறித்த நேரத்தில் இருந்த படிமத்தைப் பார்க்க அந்நேரத்தின் மீது சொடுக்கவும்.
| நாள்/நேரம் | நகம் அளவு சிறுபடம் | அளவுகள் | பயனர் | கருத்து | |
|---|---|---|---|---|---|
| தற்போதைய | 08:42, 14 மார்ச் 2019 | | 1,632 × 1,632 (366 KB) | wikimediacommons>Dragons flight | Some suggested tweaks in category labels |
கோப்பு பயன்பாடு
பின்வரும் பக்க இணைப்புகள் இப் படிமத்துக்கு இணைக்கபட்டுள்ளது(ளன):