படிமம்:Parabola circle.svg
Jump to navigation
Jump to search

Size of this PNG preview of this SVG file: 440 × 240 படப்புள்ளிகள். மற்ற பிரிதிறன்கள்: 640 × 349 படப்புள்ளிகள் | 1,024 × 559 படப்புள்ளிகள் | 1,280 × 698 படப்புள்ளிகள் | 2,560 × 1,396 படப்புள்ளிகள் .
மூலக்கோப்பு (SVG கோப்பு, பெயரளவில் 440 × 240 பிக்சல்கள், கோப்பு அளவு: 19 KB)
சுருக்கம்
| விளக்கம் |
English: The svg version of  |
| நாள் | |
| மூலம் | சொந்த முயற்சி |
| ஆசிரியர் | IkamusumeFan |
| SVG genesis | |
| மூலக் குறியீடு (கணினியியல்) | Gnuplot code# Author: Ika
# Date: 12/11/2014
set term svg font 'Times, 18' size 500,300
set output 'parabola_circle.svg'
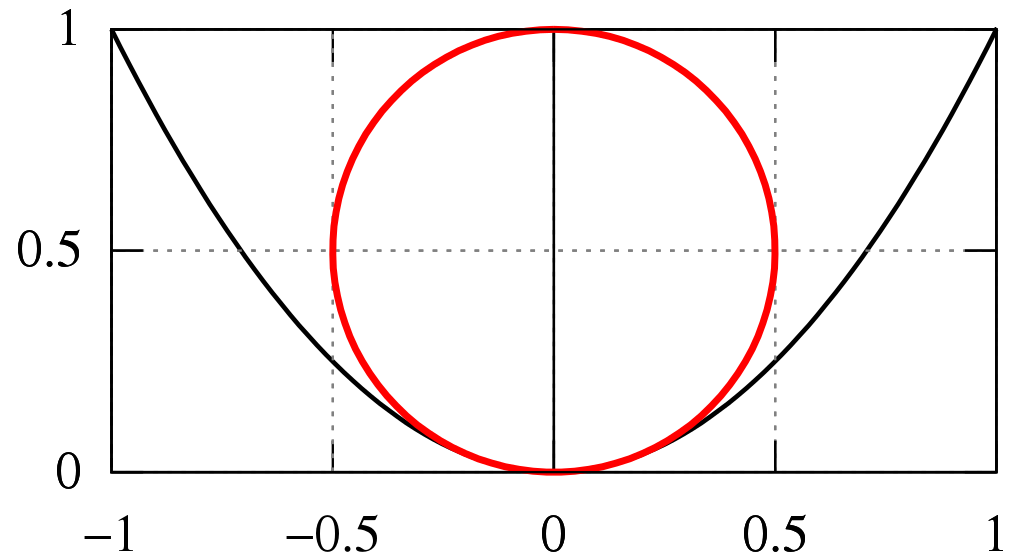
# In this program, the parabola equation is y = x^2.
# The circle equation is x^2 + (y-0.5)^2 = 1/4.
# We make it parametric as x = sin(t), y = 0.5 + cos(t).
set multiplot
# The ratio of the height and width of the plot chart is 1/2 = 0.5.
set size ratio 0.5
set xrange [-1:1]
set yrange [0:1]
# Unit along the axes is 0.5.
set xtics 0.5
set ytics 0.5
# Draw the axes.
set xzeroaxis lt -1 lc rgb "black" lw 1
set yzeroaxis lt -1 lc rgb "black" lw 1
set grid
unset label
set key off
# Draw the parabola y=x^2.
plot x*x lc rgb "black" lw 2;
# Draw the circle by using the parametric equations.
set parametric
set trange [0:2*pi]
plot 0.5*sin(t), 0.5+0.5*cos(t) lc rgb "red" lw 3;
unset multiplot
set term x11
set output
|
அனுமதி
இந்த ஆக்கத்தின் காப்புரிமையாளரான நான் இதனைப் பின்வரும் உரிமத்தின் கீழ் வெளியிடுகின்றேன்:
This file is licensed under the Creative Commons Attribution-Share Alike 4.0 International license.
- நீங்கள் சுதந்திரமாக:
- பகிர்ந்து கொள்ள – வேலையை நகலெடுக்க, விநியோகிக்க மற்றும் அனுப்ப
- மீண்டும் கலக்க – வேலைக்கு பழகிக்கொள்ள.
- கீழ்க்காணும் விதிகளுக்கு ஏற்ப,
- பண்புக்கூறுகள் – நீங்கள் பொருத்தமான உரிமையை வழங்க வேண்டும், உரிமத்திற்கான இணைப்பை வழங்க வேண்டும் மற்றும் மாற்றங்கள் செய்யப்பட்டிருந்தால் குறிப்பிட வேண்டும். நீங்கள் ஏற்புடைய எந்த முறையிலும் அவ்வாறு செய்யலாம், ஆனால் எந்த வகையிலும் உரிமதாரர் உங்களை அல்லது உங்கள் பயன்பாட்டிற்கு ஒப்புதல் அளிக்கும் படி பரிந்துரைக்க கூடாது.
- அதே மாதிரி பகிர் – நீங்கள் ரீமிக்ஸ் செய்தாலோ, உருமாற்றம் செய்தாலோ அல்லது பொருளை உருவாக்கினாலோ, உங்கள் பங்களிப்புகளை அல்லது இணக்கமான உரிமம் கீழ் அசலாக விநியோகிக்க வேண்டும்.
கோப்பின் வரலாறு
குறித்த நேரத்தில் இருந்த படிமத்தைப் பார்க்க அந்நேரத்தின் மீது சொடுக்கவும்.
| நாள்/நேரம் | நகம் அளவு சிறுபடம் | அளவுகள் | பயனர் | கருத்து | |
|---|---|---|---|---|---|
| தற்போதைய | 00:07, 30 திசம்பர் 2019 | | 440 × 240 (19 KB) | wikimediacommons>Mikhail Ryazanov | minuses, not hyphens |
கோப்பு பயன்பாடு
பின்வரும் பக்க இணைப்புகள் இப் படிமத்துக்கு இணைக்கபட்டுள்ளது(ளன):