படிமம்:World population pie chart.PNG
Jump to navigation
Jump to search
இதைவிட அளவில் பெரிய படிமம் இல்லை.
World_population_pie_chart.PNG (310 × 207 படவணுக்கள், கோப்பின் அளவு: 38 KB, MIME வகை: image/png)

|
This graph image could be re-created using vector graphics as an SVG file. This has several advantages; see Commons:Media for cleanup for more information. If an SVG form of this image is available, please upload it and afterwards replace this template with
{{vector version available|new image name}}.It is recommended to name the SVG file “World population pie chart.svg”—then the template Vector version available (or Vva) does not need the new image name parameter. |
சுருக்கம்
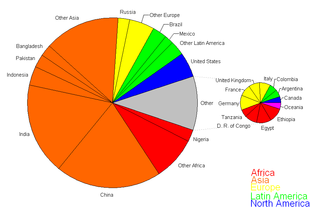
| விளக்கம் | Global population distribution by region. Colours indicate broad regions while smaller divisions within these colours indicate subregions. "Other North America" refers to Greenland and St. Pierre & Miquelon. The division between Western and Eastern Europe follows the old Iron Curtain line, except that Greece is delegated to Eastern Europe. Iceland and Finland are included in Scandinavia. Arab West Asia includes Cyprus. Mauritania and Sudan are included in North Africa while Niger is included in West Africa and Chad is included as Central Africa. Rwanda & Burundi are included as East Africa. Southern Africa is Angola, Zambia, and Mozambique south. Central Asia includes Afghanistan, Nepal, Bhutan and Mongolia. |
| நாள் | |
| மூலம் | சொந்த முயற்சி graph made with Excel, details added with Paint |
| ஆசிரியர் | Brutannica |
அனுமதி
| I, the copyright holder of this work, release this work into the public domain. This applies worldwide. சில நாடுகளில் இது சாத்தியமில்லாது போகலாம். அவ்வாறாயின் : I grant anyone the right to use this work for any purpose, without any conditions, unless such conditions are required by law. |
கோப்பின் வரலாறு
குறித்த நேரத்தில் இருந்த படிமத்தைப் பார்க்க அந்நேரத்தின் மீது சொடுக்கவும்.
| நாள்/நேரம் | நகம் அளவு சிறுபடம் | அளவுகள் | பயனர் | கருத்து | |
|---|---|---|---|---|---|
| தற்போதைய | 14:48, 18 சனவரி 2016 | | 310 × 207 (38 KB) | wikimediacommons>Vendramin Paride |
கோப்பு பயன்பாடு
பின்வரும் பக்க இணைப்புகள் இப் படிமத்துக்கு இணைக்கபட்டுள்ளது(ளன):